 One of the major investments in Configuration Manager 2012 is the ability to monitor lots of processes in Configuration Manager 2012. In this blog, part four in the series of the features in Configuration Manager 2012, I would like to point out where the monitoring feature is available in the Configuration Manager Console. Of course you still can use System Center Operations Manager to monitor your Configuration Manager 2012 hierarchy.
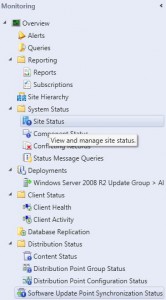
First of all let’s have a look at the theory of the Monitoring feature in Configuration Manager 2012. In the Configuration Manager 2012 Console you will find a Monitoring workspace. When you browse to the monitoring workspace you will find different sections. Each section provides information about features within Configuration Manager.
Alerts
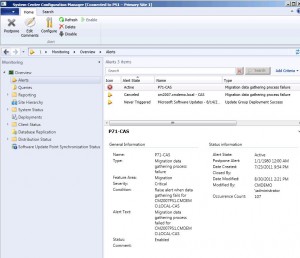
Alerts are sent when a job or process is failed or has information. Per alert you are able to write down comments or you can configure the level of the alert before closing the alert after solving the issue. Per collection you can define thresholds when Alerts need to be sent if for instance the client health falls below a percentage. Per deployment you are able to configure when to create an alert.
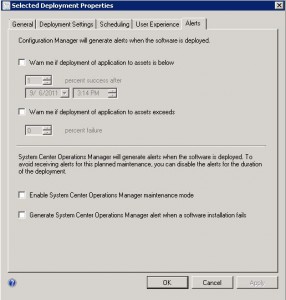
You are able to enable the alerting for instance the compliancy when creating a deployment or when you are changing the properties of a deployment.
Queries
Using queries will give you real time information from the Configuration Manager Database. You are able to define your own queries to gather information from the Configuration Manager database.
Reporting
Run standard Configuration Manager reports or create your own reports. With Configuration Manager 2012 you are able to subscribe to reports from the Configuration Manager Console. Configuration Manager 2012 comes with 441 out of the box reports that can be report information about your Configuration Manager 2012 environment. The reports are divided into the following sections.
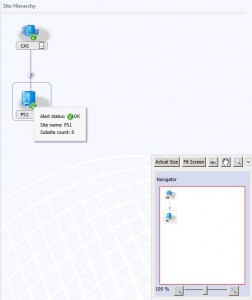
Site Hierarchy
Based on a hierarchy diagram or Geographical View you are able to view the real-time status of your Site Hierarchy. With a right mouse click you are able to jump to the error messages if they are there.
System Status
Site Status will supply information about your site and component status, conflicting records and status message queries. The system state is based on the state messages that are reported to the management point of the Configuration Manager 2012 site. A site or site component can have the following states:
- Healthy
- Warning
- Error
Deployments
Monitor all your application, software update or Operating System deployments from the Configuration Manager Console. You are able to see very quickly if a deployment of an application or software update is being deployed and in what phase the deployment is in.
You are able to browse through the following tabs:
- Unknown
- Error
- In progress
- Compliant

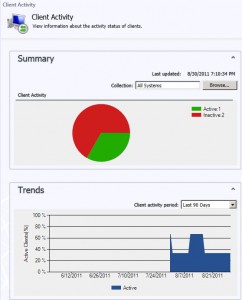
Client Status
Monitor your client health and client activity. See how your clients are doing by looking at the pie charts 🙂
Database replication
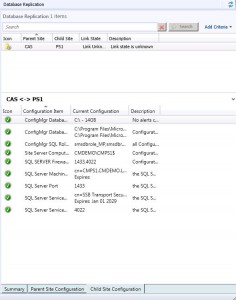
Site to Site replication is in Configuration Manager 2012 based on Database replication. Monitor the state of the links between the parent and child sites.
Look at the link state and the of the parent and child site configuration, like shown in the picture below.
Distribution Status
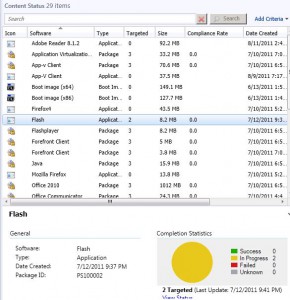
Monitor the status of the distribution of the content to the distribution points and distribution point groups and the configuration status of the distribution points.
If you select an application, software package, a software update package or Boot Image, you are able to see the completion statistics for that application like shown below
Software Update Deployment Point Synchronization status
Monitor the synchronization of the Software Update Points within your Configuration Manager 2012 hierarchy. Check the catalog version and if the synchronization status is completed.
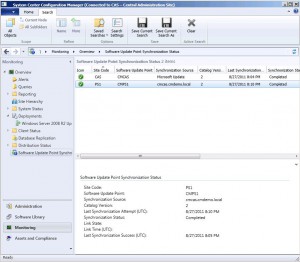
Monitoring throughout the Configuration Manager console
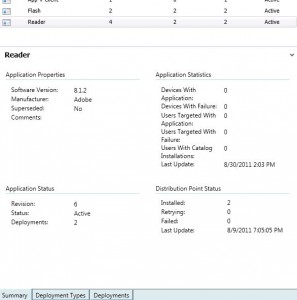
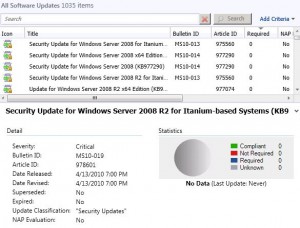
Besides the Monitoring Workspace there are lots of places where you can monitor your Configuration Manager hierarchy. When browsing to Applications or Software Updates you are also able to monitor or view the deployment status in the summary of the object.
To read earlier blogs in this series see the following blogs:
- The features of Configuration Manager 2012 overview – part 1
- The features of Configuration Manager 2012 overview – part 2
- The features of Configuration Manager 2012 overview – part 3


